
South China Geographical Journal >
Spatio-Temporal Evolution Pattern and Spatial Effect Analysis of the Development Potential of Health Tourism in China
Received date: 2023-02-24
Revised date: 2023-03-18
Online published: 2023-06-25
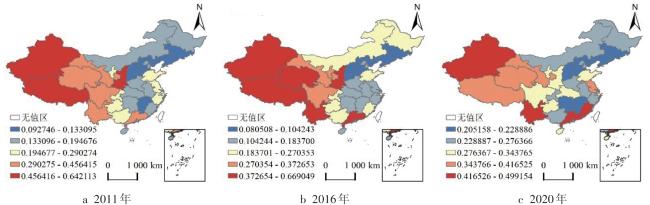
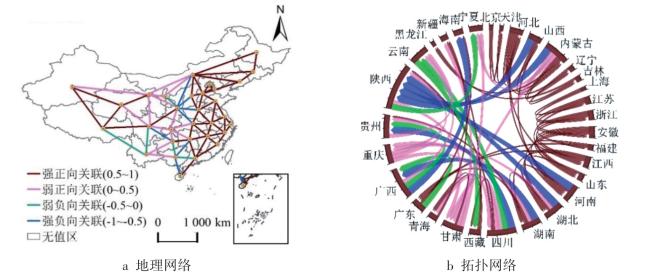
As an important part of the health industry, it is of great theoretical and practical significance to grasp the development potential of recreation tourism from a spatial and temporal perspective to clarify the development direction and pattern of recreation tourism. In the context of "health China" strategy, the study explores the spatio-temporal evolution pattern and coupling coordination types of the development potential of health tourism in China during 2011 to 2020 by adopting entropy weight method, TOPSIS method, ESTDA, spatial Dubin model, obstacle model and least variance method, locating the factors that make contribution to the spatial variation of development potential of health tourism, and that impede the improvement of the development potential. The results interpret that: (1) From 2011 to 2020, the development potential of health tourism in different regions of China is relatively low, but it shows an upward trend of fluctuation, and keeps a relatively stable spatial pattern on the whole. The development potential of health tourism in the western and southeast coastal regions has obvious changes, and the difference between them and the surrounding provinces fluctuates greatly. (2) From 2011 to 2020, the spatial spillover effect of China's health tourism development potential was weakened, and the northeast, North and central China maintained an obvious phenomenon of "low-value club aggregation". (3) On the whole China, raising tourism development potential of local cooperation situation is obviously stronger than the competition, including inbound tourism revenue per one thousand people, nature reserve area, health and technical personnel, the number of personnel of Chinese medicine, the per capita GDP and the number of students in institutions of higher learning of tourism elements such as region or the adjacent area, tourism development potential has significantly positive effects.
Key words: Health tourism; Spatio-temporal evolution; ESTDA; SDM
LI Jun , XIAN Fanji , HE Mang . Spatio-Temporal Evolution Pattern and Spatial Effect Analysis of the Development Potential of Health Tourism in China[J]. South China Geographical Journal, 2023 , 1(1) : 78 -91 . DOI: 10.20125/j.2097-2245.202301007
表1 康养旅游发展潜力评价指标体系Tab.1 Evaluation index system of development potential of health tourism |
| 系统层 | 准则层 | 指标层 | 指标属性 | 序号 | 指标解释与来源 |
|---|---|---|---|---|---|
| 康养旅游 市场潜力 | 旅游市场效益 | 国内旅游收入/元 | + | M1 | 通过《中国统计年鉴》《中国旅游统计年鉴》、各省统计年鉴直接获取数据或计算而得。 |
| 入境旅游收入/美元 | + | M2 | |||
| 国内旅游人数/万人次 | + | M3 | |||
| 入境旅游人数/万人次 | + | M4 | |||
| 旅游收入占GDP比重/% | + | M5 | |||
| 旅游市场前景 | 国内旅游收入增长率/% | + | M6 | ||
| 入境旅游收入增长率/% | + | M7 | |||
| 国内旅游人数增长率/% | + | M8 | |||
| 入境旅游人数增长率/% | + | M9 | |||
| 旅游潜在需求 | 人均可支配收入/元 | + | M10 | 《中国统计年鉴》 | |
| 老龄人口占比/% | + | M11 | |||
| 残疾人口数量/人 | + | M12 | 中国残疾人联合会官网 | ||
| 康养旅游 资源潜力 | 自然资源 | 森林覆盖面积/万公顷 | + | R1 | 《中国环境统计年鉴》 《中国统计年鉴》 |
| 森林蓄积量/万m3 | + | R2 | |||
| 湿地水域面积/千公顷 | + | R3 | |||
| 自然保护区面积/万公顷 | + | R4 | |||
| 年均降水量/mm | 适中 | R5 | |||
| 年平均气温/℃ | 适中 | R6 | |||
| 年日照时数/个 | 适中 | R7 | |||
| 空气质量达到及好于二级的天数/d | + | R8 | |||
| 可吸入颗粒物PM10/(μg·m-3) | - | R9 | |||
| 道路交通噪音/分贝 | - | R10 | |||
| 区域环境噪音/分贝 | - | R11 | |||
| 人均公园绿地面积/m2 | + | R12 | 《中国城市统计年鉴》 | ||
| 医疗资源 | 每千人医疗床位数/张 | + | R13 | 《中国卫生健康统计年鉴》 | |
| 每千人医疗卫生技术人员/人 | + | R14 | |||
| 每千人医疗机构数/个 | + | R15 | |||
| 中医类医院数/个 | + | R16 | |||
| 中医类床位数/张 | + | R17 | |||
| 中医药人员数/人 | + | R18 | |||
| 康养旅游 支撑潜力 | 经济发展支撑 | 人均地区生产总值/元 | + | S1 | 《中国统计年鉴》 |
| 第三产业增加值占GDP比重/% | + | S2 | |||
| 科技文化支撑 | 地区人均R&D经费/元 | + | S3 | ||
| 科技拨款占财政总支出的比重/% | + | S4 | |||
| 每万人普通高等学校在校学生数/人 | + | S5 | |||
| 旅游高等院校在校学生数、人 | + | S6 | 《中国旅游统计年鉴》 | ||
| 基础设施支撑 | 公路网密度/(km·百km-2) | + | S7 | 《中国统计年鉴》,路网密度=里程数/行政区面积 | |
| 铁路网密度/(km·百km-2) | + | S8 | |||
| 陆路客运量/万人 | + | S9 | |||
| 旅行社数量/个 | + | S10 | 《中国旅游统计年鉴》 | ||
| 星级酒店数量/个 | + | S11 | |||
| A级景区数量/个 | + | S12 | |||
| 环境承载支撑 | 建成区绿化覆盖率/% | + | S13 | 《中国城市统计年鉴》 | |
| 生活垃圾无害化处理率/% | + | S14 | 《中国环境统计年鉴》 | ||
| 固体废物综合利用率/% | + | S15 | |||
| 工业废水排放量/万t | - | S16 |
表2 2011—2020年中国康养旅游发展潜力描述性统计量Tab.2 Descriptive statistics of the development potential of Health tourism in China |
| 统计量 | 2011 | 2012 | 2013 | 2014 | 2015 | 2016 | 2017 | 2018 | 2019 | 2020 |
|---|---|---|---|---|---|---|---|---|---|---|
| 平均值 | 0.251 7 | 0.263 6 | 0.245 1 | 0.249 2 | 0.245 6 | 0.247 8 | 0.248 0 | 0.248 7 | 0.251 4 | 0.309 6 |
| 标准差 | 0.135 4 | 0.134 0 | 0.137 6 | 0.136 2 | 0.142 3 | 0.143 2 | 0.146 1 | 0.149 7 | 0.143 4 | 0.085 6 |
| 变异系数 | 0.538 2 | 0.508 4 | 0.561 4 | 0.546 7 | 0.579 5 | 0.577 7 | 0.589 1 | 0.602 0 | 0.570 6 | 0.276 6 |
| 偏态系数 | 1.198 | 1.295 | 1.235 | 1.166 | 1.152 | 1.201 | 1.319 | 1.256 | 1.166 | 0.820 |
| 峰态系数 | 0.921 | 1.221 | 1.025 | 0.705 | 0.667 | 0.967 | 1.482 | 1.192 | 0.791 | -0.362 |
表3 局部莫兰转移概率矩阵Tab.3 Transition probability matrix of Local Moran’s I |
| t/t+1 | HH | HL | LH | LL |
|---|---|---|---|---|
| HH | IV(6,0.194) (川、云、藏、甘、青、新) | II(0,0.000) | I(2,0.065) (桂、宁) | III(1,0.032) (渝) |
| HL | II(0,0.000) | IV(2,0.065) (粤、陕) | III(0,0.000) | I(0,0.000) |
| LH | I(1,0.032) (闽) | III(0,0.000) | IV(1,0.032) (琼) | II(1,0.032) (贵) |
| LL | III(1,0.032) (沪) | I(2,0.065) (苏、鄂) | II(2,0.065) (浙、赣) | IV(12,0.387) (京、津、冀、晋、内蒙古、吉林、黑、皖、鲁、豫、湘) |
表4 康养旅游发展潜力的全局莫兰指数Tab.4 Moran’s I of development potential of health |
| 年份 | Moran’s I | Z值 | 年份 | Moran’s I | Z值 |
|---|---|---|---|---|---|
| 2011 | 0.485*** | 4.502 | 2016 | 0.576*** | 5.291 |
| 2012 | 0.504*** | 4.691 | 2017 | 0.558*** | 5.184 |
| 2013 | 0.505*** | 4.686 | 2018 | 0.557*** | 5.145 |
| 2014 | 0.525*** | 4.830 | 2019 | 0.584*** | 5.354 |
| 2015 | 0.530*** | 4.876 | 2020 | 0.301*** | 2.848 |
|
表5 LM检验、LR检验、Hausman检验和OLS模型拟合优度结果Tab.5 Results of LM test, LR test, Hausman test and OLS regression |
| LM test | LR test | |||||
|---|---|---|---|---|---|---|
| Test | Statistic | P-value | Assumption | chi | P-value | |
| Spatial error: | SAR nested in SDM | 169.99 | 0.000 | |||
| Moran's I | 3.776 | 0.000 | SEM nested in SDM | 166.18 | 0.000 | |
| Lagrange multiplier | 60.529 | 0.000 | Hausman test | chi | P-value | |
| Robust Lagrange multiplier | 37.565 | 0.000 | 43.64 | 0.001 | ||
| Spatial lag: | OLS regression | |||||
| Lagrange multiplier | 41.201 | 0.000 | R2 | 0.864 | AIC | -883.014 |
| Robust Lagrange multiplier | 18.236 | 0.000 | Log-likelihood | 179.722 | BIC | -707.395 |
表6 SDM空间回归结果Tab.6 Results of SDM model |
| Variables | 直接效应 | 间接效应 | 总效应 | Variables | 直接效应 | 间接效应 | 总效应 |
|---|---|---|---|---|---|---|---|
| M2 | 0.013*** (0.005) | -0.007 (0.020) | 0.006 (0.024) | R18 | 0.058* (0.032) | 0.206 (0.137) | 0.264* (0.159) |
| M3 | 0.007 (0.007) | 0.072** (0.031) | 0.079** (0.034) | S1 | 0.024** (0.010) | 0.002 (0.041) | 0.026 (0.047) |
| M4 | -0.010** (0.005) | -0.061** (0.025) | -0.071** (0.029) | S4 | 1.587*** (0.355) | 1.544 (1.135) | 3.131** (1.376) |
| M7 | 0.031*** (0.005) | -0.012 (0.019) | 0.019 (0.022) | S5 | -0.091*** (0.03) | -0.228** (0.109) | -0.319** (0.128) |
| M9 | 0.025*** (0.006) | 0.078*** (0.027) | 0.103*** (0.031) | S6 | 0.009** (0.005) | 0.011 (0.018) | 0.02 (0.022) |
| M10 | -0.210** (0.106) | -0.653** (0.322) | -0.863** (0.371) | S7 | -0.067*** (0.017) | -0.255*** (0.072) | -0.322*** (0.085) |
| R4 | 0.056*** (0.007) | 0.013 (0.079) | 0.069 (0.094) | S8 | 0.048*** (0.016) | 0.037 (0.063) | 0.085 (0.075) |
| R7 | 0.037** (0.011) | 0.092*** (0.035) | 0.129*** (0.041) | S12 | 0.025*** (0.005) | 0.048** (0.022) | 0.073*** (0.026) |
| R8 | -0.032*** (0.011) | 0.02 (0.032) | -0.012 (0.038) | S13 | 0.206** (0.093) | 0.959*** (0.345) | 1.165*** (0.411) |
| R14 | 0.049** (0.017) | 0.126** (0.056) | 0.175*** (0.057) | S15 | 0.066*** (0.019) | 0.119* (0.065) | 0.185** (0.077) |
| R15 | 0.280*** (0.052) | -0.048 (0.182) | 0.232 (0.220) | rho | 0.380*** (0.071) | ||
| R16 | -0.031** (0.013) | -0.015 (0.050) | -0.046 (0.059) | ||||
| R2 | 0.0883 | AIC | -1668.519 | ||||
| Log-likelihood | 926.26 | BIC | -1324.754 | ||||
|
表7 面板门槛效应的显著性检验Tab.7 Significance test of panel threshold effect |
| 被解释变量 | 门槛变量 | 解释变量 | 门槛数 | F值 | 10% | 5% | 1% |
|---|---|---|---|---|---|---|---|
| 康养旅游发展潜力 | R8 | R8 | 单一门槛 | 4.61 | 13.509 | 15.924 | 28.769 |
| 双重门槛 | 28.07** | 14.256 | 18.633 | 34.089 | |||
| R16 | R16 | 单一门槛 | 13.27 | 17.303 | 21.429 | 29.968 | |
| 双重门槛 | 9.81 | 15.797 | 24.782 | 49.791 | |||
| S5 | S6 | 单一门槛 | 30.71** | 26.611 | 33.455 | 54.817 |
|
表8 门槛估计值和模型估计结果Tab.8 Threshold estimates and model estimates |
| 门槛估计值 | 面板门槛回归模型结果 | |||||
|---|---|---|---|---|---|---|
| 模型 | 门槛值 | 置信区间 | 变量 | 系数 | R 2 | |
| R8 | 第1个门槛 | 5.493 1 | [5.476 5,5.493 3] | R8×I(R8≤5.493 1) | 0.002 | 0.729 |
| 第2个门槛 | 5.493 3 | [5.356 6,5.497 2] | R8×I(5.493 1<R8≤5.493 3) | -0.022 | ||
| R8×I(R8>5.493 3) | 0.000 8 | |||||
| R16 | 第1个门槛 | 4.762 | [4.685,5.354] | R16×I(R16≤4.762) | -0.057*** | 0.711 1 |
| 第2个门槛 | 5.21 | [5.21, 5.21] | R16×I(4.762<R16≤5.21) | -0.049*** | ||
| R16×I(R16>5.21) | -0.033*** | |||||
| S5-S6 | 第1个门槛 | 5.714 | [5.674, 5.723] | S5×I(S5≤5.714) | 0.009** | 0.726 |
| S5×I(S5>5.714) | -0.005 | |||||
|
| 1 |
人民网. 健康中国,新时代新起步[EB/OL].(2017-10-23)[2021-06-30].
|
| 2 |
中华人民共和国中央人民政府. 中华人民共和国国民经济和社会发展第十四个五年规划和2035年远景目标纲要[EB/OL].(2021-03-13)[2022-03-18].
|
| 3 |
钟瑞添, 段丽君.习近平关于健康中国的重要论述及其意义[J].理论视野, 2021(3): 31-37.
|
| 4 |
杨敏.青海旅游产业的发展潜力评估[J].统计与决策, 2006(14): 102-104.
|
| 5 |
张贝尔, 黄晓霞. 康养旅游产业适宜性评价指标体系构建及提升策略[J].经济纵横, 2020(3): 78-86.
|
| 6 |
黄震方, 葛军莲, 储少莹.国家战略背景下旅游资源的理论内涵与科学问题[J].自然资源学报, 2020, 35(7): 1511-1524.
|
| 7 |
|
| 8 |
李济任, 许东.基于AHP与模糊综合评价法的森林康养旅游开发潜力评价——以辽东山区为例[J].中国农业资源与区划, 2018, 39(8): 135-142+169.
|
| 9 |
刘庆余, 弭宁.全域旅游视野下健康养生旅游发展对策[J].旅游学刊, 2016, 31(11): 4-6.
|
| 10 |
谢晓红, 郭倩, 吴玉鸣.我国区域性特色小镇康养旅游模式探究[J].生态经济, 2018, 34(9): 150-154.
|
| 11 |
何莽.基于需求导向的康养旅游特色小镇建设研究[J].北京联合大学学报(人文社会科学版), 2017, 15(2): 41-47.
|
| 12 |
|
| 13 |
|
| 14 |
任宣羽.康养旅游:内涵解析与发展路径[J].旅游学刊, 2016, 31(11): 1-4.
|
| 15 |
|
| 16 |
|
| 17 |
郑群明, 刘嘉, 朱岩, 等. 森林保健旅游对游客亚健康改善的感知研究[J].资源科学, 2017, 39(6): 1171-1181.
|
| 18 |
|
| 19 |
|
| 20 |
马勇, 董观志. 区域旅游持续发展潜力模型研究[J].旅游学刊, 1997(4): 36-40+62.
|
| 21 |
吴必虎.旅游系统:对旅游活动与旅游科学的一种解释[J].旅游学刊, 1998(1): 20-24.
|
| 22 |
曹新向.中国省域旅游业发展潜力的比较研究[J].人文地理, 2007(1): 18-22.
|
| 23 |
王兆峰.区域旅游产业发展潜力评价指标体系构建研究[J].华东经济管理, 2008(10): 31-35.
|
| 24 |
于秋阳.旅游产业发展潜力的结构模型及其测度研究[J].华东师范大学学报(哲学社会科学版), 2009, 41(5): 114-119.
|
| 25 |
|
| 26 |
|
| 27 |
|
| 28 |
郭来喜.中西融通互鉴,加快旅游规划体系建设[J].国外城市规划, 2000(3): 1.
|
| 29 |
王赵.国际旅游岛:海南要开好康养游这个“方子”[J].今日海南, 2009(12): 12.
|
| 30 |
何方永.中国西部省域生态旅游发展潜力评价[J].干旱区资源与环境, 2015, 29(4): 189-194.
|
| 31 |
刘安乐, 杨承玥, 明庆忠, 等.贵州县域乡村旅游发展潜力评价及其空间分异特征[J].桂林理工大学学报, 2021, 41(3): 695-704.
|
| 32 |
王娟, 明庆忠.山地旅游发展潜力评价研究[J].资源开发与市场, 2019, 35(12): 1537-1542.
|
| 33 |
王兆峰, 史伟杰, 苏昌贵.中国康养旅游地空间分布格局及其影响因素[J].经济地理, 2020, 40(11): 196-207.
|
| 34 |
王鸣涛, 叶春明.基于熵权TOPSIS的区域工业绿色制造水平评价研究[J].科技管理研究, 2020, 40(17): 53-60.
|
| 35 |
纪小美, 陶卓民, 陈金华, 等.中国国际旅游省份差异的时空交互特征——基于主要客源市场的对比[J].地理研究, 2016, 35(2): 363-376.
|
| 36 |
方世敏,黄琰.长江经济带旅游效率与规模的时空演化及耦合协调[J].地理学报, 2020, 75(8): 1757-1772.
|
| 37 |
|
| 38 |
|
| 39 |
|
| 40 |
金贵, 邓祥征, 董寅, 等.发展地理学视角下中国多维贫困测度及时空交互特征[J].地理学报, 2020, 75(8): 1633-1646.
|
| 41 |
|
| 42 |
陈瑶, 陈湘满.房价、房价收入比对中国城镇化的影响与空间效应实证分析[J].经济地理, 2021, 41(4): 57-65.
|
| 43 |
谢文彩, 李星明, 向兴, 等.武汉市康养旅游地空间布局及其优化研究[J].华中师范大学学报(自然科学版), 2018, 52(1): 147-154.
|
| 44 |
唐健雄, 陈宁, 马梦瑶, 等.长株潭城市群康养旅游地空间结构及其差异[J].陕西师范大学学报(自然科学版), 2019, 47(3): 115-124.
|
| 45 |
杨秀成, 宋立中, 钟姚越, 等.福建省康养旅游资源空间分布特征及其影响因素研究[J].福建师范大学学报(自然科学版), 2019, 35(5): 106-116.
|
/
| 〈 |
|
〉 |