
粤港澳大湾区高等教育资源空间分布均衡性及影响因素研究
|
吴大放(1981—),男,湖南岳阳人,博士,副教授,主要从事土地资源开发利用与保护研究。E-mail:Wudafang@gzhu.edu.cn |
收稿日期: 2024-01-11
修回日期: 2024-02-01
网络出版日期: 2024-12-13
基金资助
国家重点研发计划(2022YFB3903704)
2022年度广州市高等教育教学质量与教学改革工程教学团队项目(2022JXTD001)
2022年广州市教育局高校科研项目(202235269)
2023年教育教学研究和改革项目(WGKM2023139)
2023年度广东省本科高校教学质量与教学改革工程项目(269)
2024年广州大学产教融合教学改革建设项目(24CJRH13)
2024年广州市高校科产教融合实践教学基地项目(2024KCJJD002)
2023年度广州市质量工程建设项目(2023KCSZ004)
Research of the Equilibrium of Spatial Distribution and Influencing Factors of Higher Education Resources in Guangdong-Hong Kong-Macao Greater Bay Area
Received date: 2024-01-11
Revised date: 2024-02-01
Online published: 2024-12-13
高等教育资源的空间分布和配置直接关系到地区的创新能力和竞争力。粤港澳大湾区作为中国最具活力的经济区域,高等教育资源的合理布局对支撑其进阶成为世界一流湾区至关重要。文章基于地理空间视角,总结国内外的研究和不足,遵循“资源格局分布及影响机制”的路径,采用GINI系数和地理探测器分析方法,对粤港澳大湾区的高等教育资源空间分布均衡性及影响因素进行分析。研究发现:(1)粤港澳大湾区的高等教育资源的空间分布具有明显的不平衡性,其中广州和深圳尤为明显;(2)粤港澳大湾区的高等教育资源空间分布与城市中小学在校生数量、城市人均GDP、城市人口数量和城市教育支出等因子高度相关,特别是受中小学在校生数量的影响非常大,说明高等教育受基础教育影响较大;(3)在交互因子探测中,城市中小学在校生数量,在与经济、教育、就业和社会人口结构等因子相互作用时会达到较大的非线性增强作用。粤港澳大湾区教育资源空间结构在未来会以香港、澳门、广州和深圳为核心,珠海、东莞、佛山等7所城市为外围的地理空间圈层结构,辐射带动周边区域的发展。研究有助于理解大湾区高等教育资源空间结构均衡性的具体差距,也有益于对高等教育资源合理配置和政策的倾斜。
吴大放 , 蓝婉倩 , 何尹杰 , 许国洋 , 张秋林 , 张灿嘉 , 刘乾进 , 陈若琳 . 粤港澳大湾区高等教育资源空间分布均衡性及影响因素研究[J]. 华南地理学报, 2024 , 2(2) : 1 -10 . DOI: 10.20125/j.2097-2245.202402001
The spatial distribution and allocation of higher education resources are directly related to the region's innovation ability and competitiveness. As China's most dynamic economic region, rational layout of higher education resources of the Guangdong-Hong Kong-Macao Greater Bay Area is crucial to support its advancement into a world-class bay area. Based on the perspective of geographic space, this study summarizes the shortcomings of domestic and foreign research, follows the path of "resource pattern distribution and influencing mechanism", and uses the GINI coefficient and geographic detector analysis method to analyze the spatial distribution balance and influencing factors of higher education resources in the Guangdong-Hong Kong-Macao Greater Bay Area. The research shows: (1) The spatial distribution of higher education resources in the Guangdong-Hong Kong-Macao Greater Bay Area is obviously unbalanced, among which Guangzhou and Shenzhen are obviously unbalanced relative to population and economic distribution. (2) The spatial distribution of higher education resources in the Guangdong-Hong Kong-Macao Greater Bay Area is highly correlated with factors such as the number of urban primary and secondary school students, urban per capita GDP, urban population and urban education expenditure. In particular, it is greatly affected by the number of primary and secondary school students, indicating that higher education is greatly affected by basic education. (3) In the interactive factor detection, the number of urban primary and secondary school students combined with other factors will achieve a large nonlinear enhancement effect. It is expected that the spatial structure of educational resources in the Guangdong-Hong Kong-Macao Greater Bay Area will form a geographical spatial circle structure with four core cities of Hong Kong, Macao, Guangzhou and Shenzhen, and other cities such as Zhuhai, Dongguan and Foshan as the periphery in the future, radiating and driving the development of surrounding areas. The research helps to understand the specific gaps in the balance of the spatial structure of higher education resources in the Greater Bay Area, which is beneficial to the rational allocation of higher education resources and the rational tilt of policies.
表1 GINI系数分布区间Tab.1 GINI coefficient distribution interval |
| GINI系数分布区间 | 数据分布平均状况 |
|---|---|
| 0.0~0.2 | 绝对平均 |
| 0.2~0.3 | 比较平均 |
| 0.3~0.4 | 相对合理 |
| 0.4~0.5 | 差距较大 |
| 0.5~0.6 | 较不平均 |
| 0.6~1.0 | 绝对不平均 |
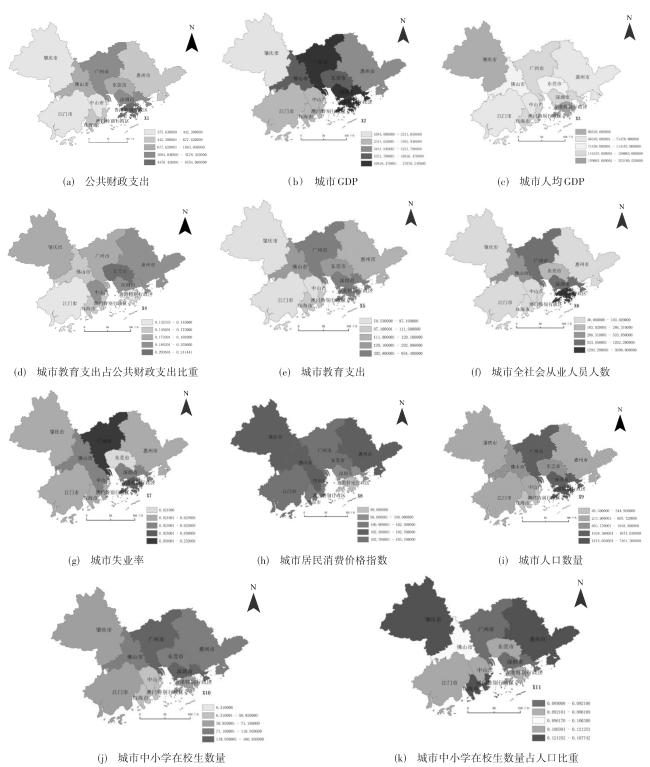
表 2 影响因子的选取Tab.2 Selection of influence factors |
| 类型 | 因子 |
|---|---|
| 经济 | X 1公共财政支出 |
| X 2城市GDP | |
| X 3城市人均GDP | |
| 教育 | X 4城市教育支出占公共财政支出比重 |
| X 5城市教育支出 | |
| 就业 | X 6城市全社会从业人员人数 |
| X 7城市失业率 | |
| X 8城市居民消费价格指数 | |
| 社会人口结构 | X 9城市人口数量 |
| X 10城市中小学在校生数量 | |
| X 11城市中小学在校生数量占人口比重 |
表3 各市在校加权学生数量作为指标得到的GINI系数Tab.3 GINI coefficient values obtained by using the weighted number of students in schools in each municipality as an indicator |
| 地区/GINI系数 | 广州 | 深圳 | 珠海 | 佛山 | 惠州 | 东莞 | 中山 | 江门 | 肇庆 | 香港 | 澳门 |
|---|---|---|---|---|---|---|---|---|---|---|---|
| 广州 | 0.000 | 0.810 | 0.851 | 0.821 | 0.988 | 0.873 | 0.985 | 0.976 | 0.965 | 0.499 | 0.943 |
| 深圳 | 0.810 | 0.000 | 0.132 | 0.036 | 0.892 | 0.217 | 0.868 | 0.791 | 0.714 | 0.521 | 0.563 |
| 珠海 | 0.851 | 0.132 | 0.000 | 0.097 | 0.862 | 0.088 | 0.832 | 0.736 | 0.643 | 0.611 | 0.467 |
| 佛山 | 0.821 | 0.036 | 0.097 | 0.000 | 0.885 | 0.183 | 0.859 | 0.777 | 0.696 | 0.546 | 0.539 |
| 惠州 | 0.988 | 0.892 | 0.862 | 0.885 | 0.000 | 0.837 | 0.107 | 0.345 | 0.491 | 0.965 | 0.661 |
| 东莞 | 0.873 | 0.217 | 0.088 | 0.183 | 0.837 | 0.000 | 0.802 | 0.692 | 0.588 | 0.663 | 0.394 |
| 中山 | 0.985 | 0.868 | 0.832 | 0.859 | 0.107 | 0.802 | 0.000 | 0.247 | 0.406 | 0.957 | 0.597 |
| 江门 | 0.976 | 0.791 | 0.736 | 0.777 | 0.345 | 0.692 | 0.247 | 0.000 | 0.176 | 0.929 | 0.410 |
| 肇庆 | 0.965 | 0.714 | 0.643 | 0.696 | 0.491 | 0.588 | 0.406 | 0.176 | 0.000 | 0.900 | 0.252 |
| 香港 | 0.499 | 0.521 | 0.611 | 0.546 | 0.965 | 0.663 | 0.957 | 0.929 | 0.900 | 0.000 | 0.838 |
| 澳门 | 0.943 | 0.563 | 0.467 | 0.539 | 0.661 | 0.394 | 0.597 | 0.410 | 0.252 | 0.838 | 0.000 |
表4 各市单位面积上高校在校人数作为指标得到的GINI系数Tab.4 GINI coefficient value obtained by using the number of college students in each municipality per unit area as an indicator |
| 地区/GINI系数 | 广州 | 深圳 | 珠海 | 佛山 | 惠州 | 东莞 | 中山 | 江门 | 肇庆 | 香港 | 澳门 |
|---|---|---|---|---|---|---|---|---|---|---|---|
| 广州 | 0.000 | 0.533 | 0.349 | 0.646 | 0.936 | 0.533 | 0.694 | 0.935 | 0.895 | 0.193 | 0.725 |
| 深圳 | 0.533 | 0.000 | 0.225 | 0.174 | 0.804 | 0.001 | 0.256 | 0.803 | 0.694 | 0.658 | 0.907 |
| 珠海 | 0.349 | 0.225 | 0.000 | 0.384 | 0.871 | 0.226 | 0.455 | 0.871 | 0.795 | 0.508 | 0.857 |
| 佛山 | 0.646 | 0.174 | 0.384 | 0.000 | 0.733 | 0.173 | 0.087 | 0.731 | 0.591 | 0.746 | 0.934 |
| 惠州 | 0.936 | 0.804 | 0.871 | 0.733 | 0.000 | 0.804 | 0.690 | 0.003 | 0.250 | 0.956 | 0.989 |
| 东莞 | 0.533 | 0.001 | 0.226 | 0.173 | 0.804 | 0.000 | 0.256 | 0.803 | 0.693 | 0.658 | 0.907 |
| 中山 | 0.694 | 0.256 | 0.455 | 0.087 | 0.690 | 0.256 | 0.000 | 0.688 | 0.532 | 0.782 | 0.944 |
| 江门 | 0.935 | 0.803 | 0.871 | 0.731 | 0.003 | 0.803 | 0.688 | 0.000 | 0.247 | 0.956 | 0.989 |
| 肇庆 | 0.895 | 0.694 | 0.795 | 0.591 | 0.250 | 0.693 | 0.532 | 0.247 | 0.000 | 0.928 | 0.983 |
| 香港 | 0.193 | 0.658 | 0.508 | 0.746 | 0.956 | 0.658 | 0.782 | 0.956 | 0.928 | 0.000 | 0.618 |
| 澳门 | 0.725 | 0.907 | 0.857 | 0.934 | 0.989 | 0.907 | 0.944 | 0.989 | 0.983 | 0.618 | 0.000 |
表5 各市高等教育规模相对总人口的GINI系数Tab.5 GINI coefficient of the size of higher education in each municipality relative to the total population |
| 地区/GINI系数 | 广州 | 深圳 | 珠海 | 佛山 | 惠州 | 东莞 | 中山 | 江门 | 肇庆 | 香港 | 澳门 |
|---|---|---|---|---|---|---|---|---|---|---|---|
| 广州 | 0.000 | 0.746 | 0.118 | 0.624 | 0.840 | 0.438 | 0.634 | 0.815 | 0.621 | 0.563 | 0.417 |
| 深圳 | 0.746 | 0.000 | 0.688 | 0.228 | 0.253 | 0.457 | 0.212 | 0.176 | 0.232 | 0.315 | 0.477 |
| 珠海 | 0.118 | 0.688 | 0.000 | 0.546 | 0.802 | 0.337 | 0.558 | 0.771 | 0.543 | 0.477 | 0.314 |
| 佛山 | 0.624 | 0.228 | 0.546 | 0.000 | 0.455 | 0.256 | 0.017 | 0.388 | 0.005 | 0.094 | 0.280 |
| 惠州 | 0.840 | 0.253 | 0.802 | 0.455 | 0.000 | 0.637 | 0.441 | 0.081 | 0.458 | 0.526 | 0.652 |
| 东莞 | 0.438 | 0.457 | 0.337 | 0.256 | 0.637 | 0.000 | 0.272 | 0.586 | 0.252 | 0.166 | 0.026 |
| 中山 | 0.634 | 0.212 | 0.558 | 0.017 | 0.441 | 0.272 | 0.000 | 0.374 | 0.021 | 0.110 | 0.295 |
| 江门 | 0.815 | 0.176 | 0.771 | 0.388 | 0.081 | 0.586 | 0.374 | 0.000 | 0.392 | 0.465 | 0.602 |
| 肇庆 | 0.621 | 0.232 | 0.543 | 0.005 | 0.458 | 0.252 | 0.021 | 0.392 | 0.000 | 0.089 | 0.276 |
| 香港 | 0.563 | 0.315 | 0.477 | 0.094 | 0.526 | 0.166 | 0.110 | 0.465 | 0.089 | 0.000 | 0.191 |
| 澳门 | 0.417 | 0.477 | 0.314 | 0.280 | 0.652 | 0.026 | 0.295 | 0.602 | 0.276 | 0.191 | 0.000 |
表 6 各市高等教育相对经济分布的GINI系数Tab.6 GINI coefficient for the relative economic distribution of higher education in various municipalities |
| 地区/GINI系数 | 广州 | 深圳 | 珠海 | 佛山 | 惠州 | 东莞 | 中山 | 江门 | 肇庆 | 香港 | 澳门 |
|---|---|---|---|---|---|---|---|---|---|---|---|
| 广州 | 0.000 | 0.859 | 0.117 | 0.589 | 0.300 | 0.579 | 0.491 | 0.498 | 0.205 | 0.628 | 0.385 |
| 深圳 | 0.859 | 0.000 | 0.824 | 0.546 | 0.752 | 0.556 | 0.635 | 0.630 | 0.793 | 0.500 | 0.708 |
| 珠海 | 0.117 | 0.824 | 0.000 | 0.507 | 0.190 | 0.495 | 0.397 | 0.405 | 0.090 | 0.552 | 0.280 |
| 佛山 | 0.589 | 0.546 | 0.507 | 0.000 | 0.350 | 0.015 | 0.137 | 0.128 | 0.436 | 0.063 | 0.264 |
| 惠州 | 0.300 | 0.752 | 0.190 | 0.350 | 0.000 | 0.337 | 0.224 | 0.233 | 0.101 | 0.404 | 0.095 |
| 东莞 | 0.579 | 0.556 | 0.495 | 0.015 | 0.337 | 0.000 | 0.122 | 0.113 | 0.424 | 0.078 | 0.250 |
| 中山 | 0.491 | 0.635 | 0.397 | 0.137 | 0.224 | 0.122 | 0.000 | 0.010 | 0.318 | 0.198 | 0.131 |
| 江门 | 0.498 | 0.630 | 0.405 | 0.128 | 0.233 | 0.113 | 0.010 | 0.000 | 0.327 | 0.189 | 0.141 |
| 肇庆 | 0.205 | 0.793 | 0.090 | 0.436 | 0.101 | 0.424 | 0.318 | 0.327 | 0.000 | 0.486 | 0.195 |
| 香港 | 0.628 | 0.500 | 0.552 | 0.063 | 0.404 | 0.078 | 0.198 | 0.189 | 0.486 | 0.000 | 0.321 |
| 澳门 | 0.385 | 0.708 | 0.280 | 0.264 | 0.095 | 0.250 | 0.131 | 0.141 | 0.195 | 0.321 | 0.000 |
表7 单因子探测结果Tab.7 Single factor detection results |
| 指标 | 一级区 | 二级区 | 三级区 | 四级区 | 五级区 | q值 |
|---|---|---|---|---|---|---|
| 公共财政支出 | 375.63~442.38 | 442.38~677.62 | 677.62~1 003.04 | 1 003.04~4 178.42 | 4 178.42~6 554 | 0.269 5 |
| 城市GDP | 1 684.09~2 311.65 | 2 311.65~3 481.94 | 3 481.94~4 221.79 | 4 221.79~10 816.47 | 10 816.47~27 670.24 | 0.396 3 |
| 城市人均GDP | 56318 | 56 318~71 478 | 71 478~114 157 | 114 157~159 883 | 159 883~323 180.52 | 0.645 4 |
| 城市教育支出占公共财政支出比重 | 0.132 5~0.145 6 | 0.145 6~0.172 0 | 0.172 0~0.189 2 | 0.189 2~0.203 6 | 0.203 6~0.241 4 | 0.342 1 |
| 城市教育支出 | 78.53~87.1 | 87.1~111.9 | 111.9~129.1 | 129.1~202.89 | 202.89~954.4 | 0.472 8 |
| 城市全社会从业人员人数 | 36.06~103.02 | 103.02~286.31 | 286.31~533.85 | 533.85~1 292.29 | 1 292.29~3 690.9 | 0.050 4 |
| 城市失业率 | 0.021 8 | 0.021 8~0.023 9 | 0.023 9~0.025 0 | 0.025~0.058 | 0.058~0.252 | 0.174 2 |
| 城市居民消费价格指数 | 99.9 | 99.9~100.9 | 100.9~102.3 | 102.3~102.7 | 102.7~103.1 | 0.073 8 |
| 城市人口数量 | 68.5~244.96 | 244.96~605.72 | 605.72~1 048.36 | 1 048.36~1 874.03 | 1 874.03~7 401.5 | 0.485 8 |
| 城市中小学在校生数量 | 6.31 | 6.31~50.92 | 50.92~71.18 | 71.18~119.95 | 119.95~166.83 | 0.948 7 |
| 城市中小学在校生数量占人口比重 | 0.089 0~0.092 1 | 0.092 1~0.096 2 | 0.096 2~0.106 3 | 0.106 3~0.121 3 | 0.121 3~0.167 7 | 0.358 5 |
表 8 交互因子探测结果Tab.8 Detection results of interaction factors |
| 因子 | X 1 | X 2 | X 3 | X 4 | X 5 | X 6 | X 7 | X 8 | X 9 | X 10 | X 11 |
|---|---|---|---|---|---|---|---|---|---|---|---|
| X 1 | 0.265 9 | ||||||||||
| X 2 | 0.992 6 | 0.396 3 | |||||||||
| X 3 | 0.992 6 | 0.992 6 | 0.645 4 | ||||||||
| X 4 | 1.000 0 | 1.000 0 | 0.685 6 | 0.342 1 | |||||||
| X 5 | 0.992 6 | 0.980 7 | 0.992 6 | 1.000 0 | 0.472 8 | ||||||
| X 6 | 0.990 0 | 0.463 2 | 0.992 6 | 0.467 4 | 0.532 7 | 0.050 4 | |||||
| X 7 | 0.496 9 | 0.997 4 | 1.000 0 | 0.999 8 | 1.000 0 | 0.488 6 | 0.174 2 | ||||
| X 8 | 0.499 4 | 0.473 0 | 0.999 7 | 0.999 7 | 0.999 8 | 0.216 2 | 0.327 9 | 0.073 8 | |||
| X 9 | 0.992 6 | 0.992 6 | 0.992 5 | 0.999 7 | 0.532 6 | 0.532 7 | 1.000 0 | 0.999 7 | 0.485 8 | ||
| X 10 | 0.992 9 | 0.991 7 | 0.992 9 | 0.971 4 | 0.992 9 | 0.991 8 | 1.000 0 | 0.999 5 | 0.992 9 | 0.948 7 | |
| X 11 | 0.990 0 | 0.992 7 | 0.992 7 | 1.000 0 | 0.992 7 | 0.989 4 | 0.511 3 | 0.998 9 | 0.992 7 | 0.993 0 | 0.358 5 |
| 1 |
刘华军, 张权, 杨骞.中国高等教育资源空间分布的非均衡与极化研究[J].教育发展研究, 2013,33(9):1-7.
|
| 2 |
刘宁宁. 我国城市高等教育资源集聚水平及空间格局探析[J].高校教育管理, 2019,13(1):82-89.
|
| 3 |
王志强. 粤港澳大湾区高等教育空间布局:框架、现实与进路[J].中国高教研究, 2020(6):79-85.
|
| 4 |
齐宏纲, 戚伟, 刘盛和.港澳大湾区人才集聚的演化格局及影响因素[J].地理研究, 2020,39(9):2000-2014.
|
| 5 |
黄炳超, 陈先哲. 粤港澳大湾区高等教育治理的时空格局、形态嬗变及未来路向[J]. 国家教育行政学院学报, 2021,287(11):36-45.
|
| 6 |
李清刚.城市群空间演进背景下粤港澳高等教育的布局调适[J].高校教育管理, 2024,18(1):70-80.
|
| 7 |
Quartey, Dorcaslove Naa Oyo. Spatial patterns of women enrolled in undergraduate higher education coursework in the US from 2010 to 2020. MS thesis[M]. Kalamazoo: Western Michigan University, 2024.
|
| 8 |
Verdis, Athanasios,
|
| 9 |
马浚锋.“从集聚走向均衡”: 中国高校顶尖人才集聚的空间溢出效应及其收敛性[J].科技进步与对策, 2024,41(15):12-21.
|
| 10 |
Henri, Lefebvre, and DonaldNicholson-Smith. The production of space[M]. Massachusetts: Blackwell, 1991.
|
| 11 |
Bradford, Michael. Education, attainment and the geography of choice[J]. Geography, 1990,75(1):3-16.
|
| 12 |
Ainsworth,
|
| 13 |
Brattbakk, Ingar. Block, neighbourhood or district? The importance of geographical scale for area effects on educational attainment[J]. Human Geography, 2014,96(2):109-125.
|
| 14 |
Gordon, Ian,
|
| 15 |
Brattbakk, Ingar,
|
| 16 |
Maloutas, Thomas. Middle class education strategies and residential segregation in Athens[J]. Journal of Education Policy, 2007,22(1):49-68.
|
| 17 |
Maloutas, Thomas, and Isabel Ramos Lobato. Education and social reproduction: Educational mechanisms and residential segregation in Athens and Dortmund[J]. Local Economy, 2015,30(7):800-817.
|
| 18 |
Zahl-Thanem, Alexander, Johan Fredrik Rye. Spatial inequality in higher education: A growing urban-rural educational gap?[J]. European Sociological Review, 2024:jcae015.
|
| 19 |
游小珺, 赵光龙, 杜德斌, 等.中国高等教育经费投入空间格局及形成机理研究[J].地理科学, 2016,36(2):180-187.
|
| 20 |
袁振杰, 郭隽万果, 杨韵莹, 等.中国优质基础教育资源空间格局形成机制及综合效应[J].地理学报, 2020,75(2):318-331.
|
| 21 |
潘璐璐, 张炜, 赵红星, 等.我国东西部高等教育布局结构研究[J].数学的实践与认识, 2005,35(11):92-98.
|
| 22 |
方远平, 肖亚儿, 宋雅玲, 等.珠三角地区电子信息产业空间格局及影响因素——基于企业POI数据的分析[J].华南地理学报, 2023,1(2):15-26.
|
| 23 |
何尹杰, 张占录, 高文文.北京市政府搬迁至副中心对通州土地利用影响[J].水土保持研究, 2022,29(3):351-357, 366.
|
| 24 |
王劲峰, 徐成东.地理探测器:原理与展望[J].地理学报, 2017,72(1):116-134.
|
| 25 |
蔡蔚萍.高等教育的空间分布及其社会后果研究[D].武汉: 武汉大学, 2017-06.
|
| 26 |
乔文.我国高等教育投资效率的空间差距及影响因素分析[D].济南: 山东财经大学, 2017-06.
|
| 27 |
吴大放, 刘艳艳, 何尹杰, 等.人文地理与城乡规划专业“BCAC”实践教学综合改革与创新[J].高师理科学刊, 2020,40(6):101-106.
|
/
| 〈 |
|
〉 |